Create powerful reports
For a reliable forecast and adjustment of your budgets
Tabular…
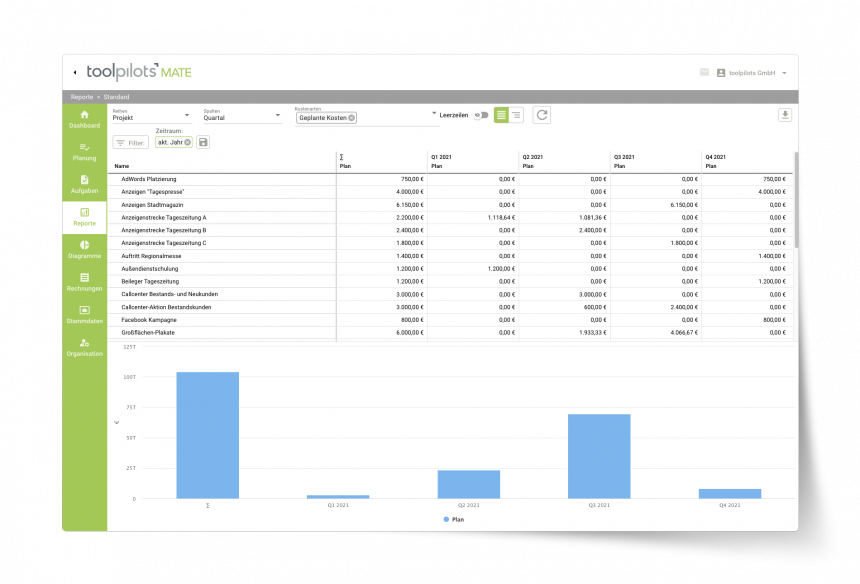
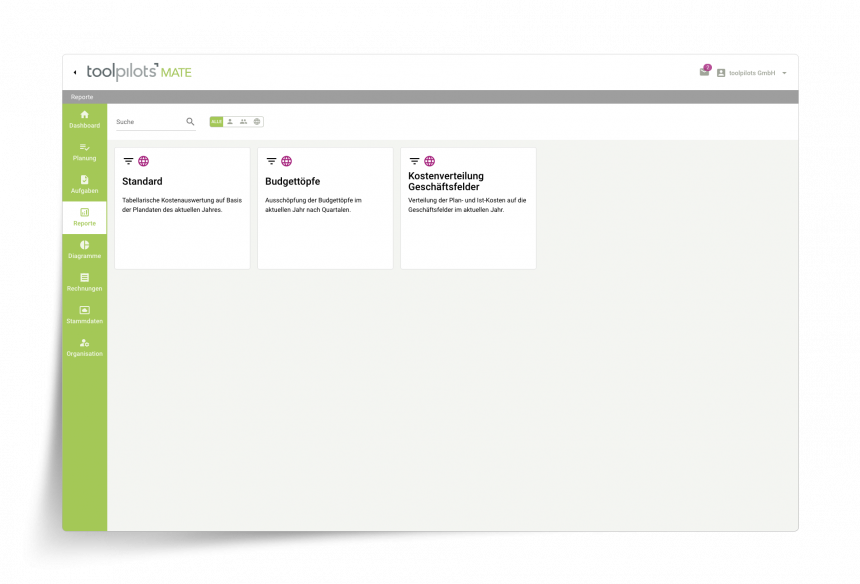
With toolpilots MATE you can create different views of your costs and the associated budgets with just one click. The cost report provides you with a detailed, tabular overview of all project costs and the associated budgets - organized by time and subject.
…or visual interactive
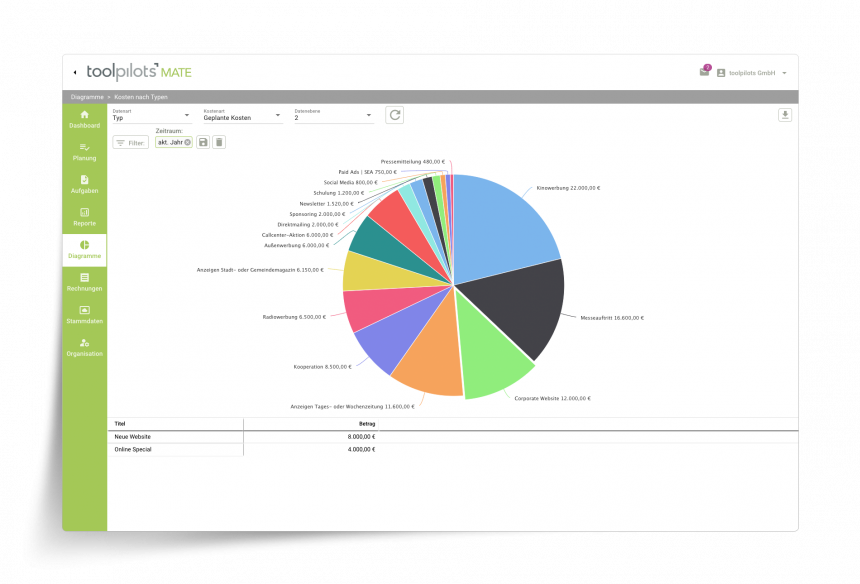
The interactive pie charts provide you with a quick overview of the functional distribution of costs, e.g. according to products or service providers. This, of course, for all cost types and for hierarchical categories with different levels of detail.
All cost types in view
In both the cost report and the pie charts, you can choose which cost type the evaluation is based on. In the cost report, you can also create differences between cost types, for example, in order to carry out a plan/actual comparison or to display the utilization of budgets.

By time or by categories
In the cost report, you can freely choose which information is displayed in the table rows and which in the corresponding table columns. In addition to the content categories, months, quarters or years can also be displayed as columns. In this way, the individual costs can also be compared at the time level.

Filter
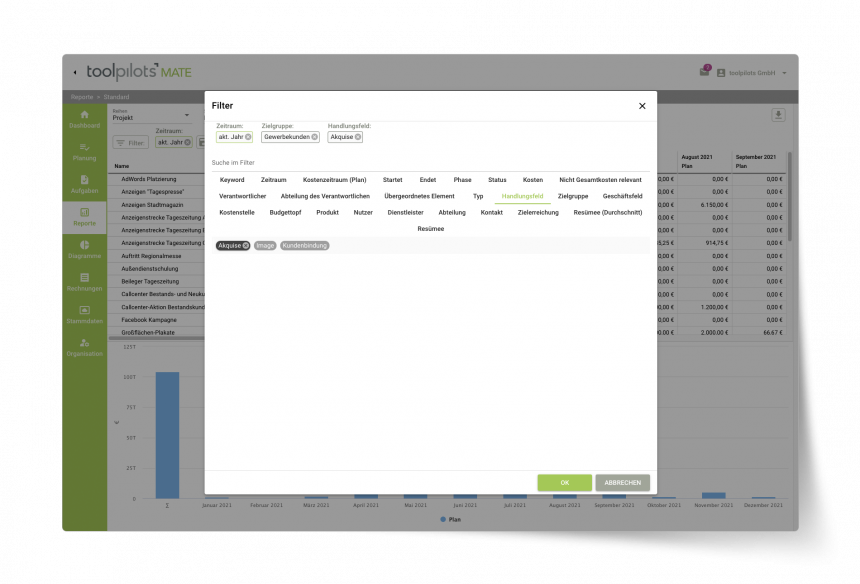
Analogous to planning, you also define any filters for the reports and diagrams in order to technically limit the selection of projects to be evaluated. With a few clicks, you can reduce the set of underlying projects to the essentials using a combination of selected category elements.
Just for you or for everyone in the team
The configuration of each report or chart can be saved in the system with the selected filter settings and made available to other team members or all users of your company.
Export as Excel document
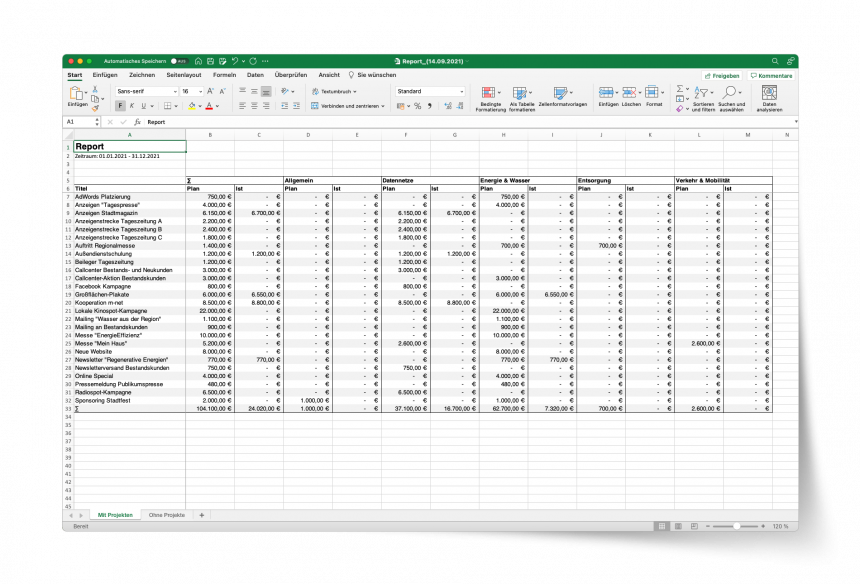
With the export function you can save the current report as an Excel document and use it as a basis for further calculations. All filtering of the projects made in the report will of course be taken into account.
